
Health & Monitoring
Liveness, readiness, and startup probes, plus a Prometheus metrics endpoint — the same operational visibility we use to keep Travix Cloud running, available to your own infrastructure team too.
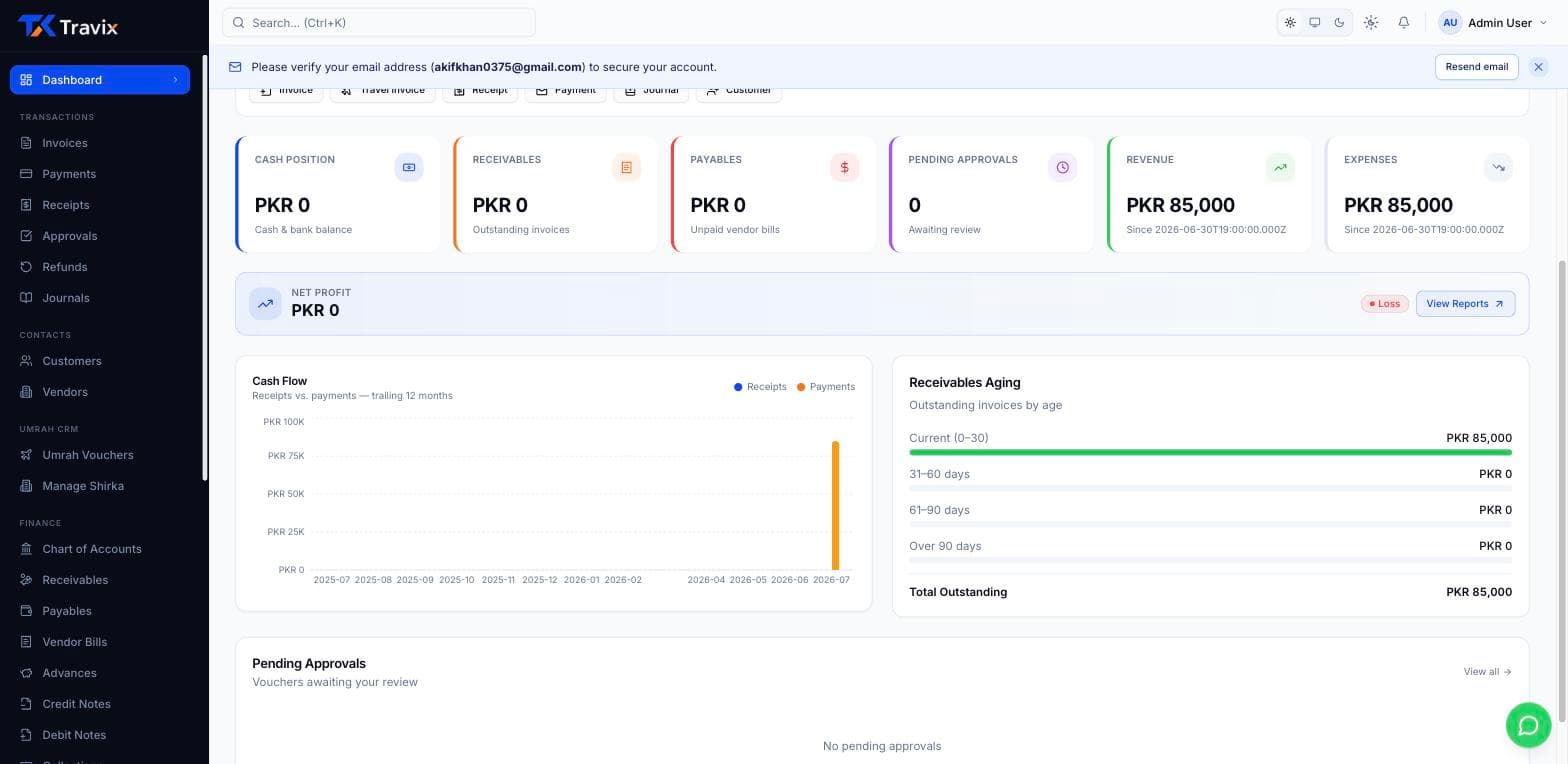
Monitoring dashboard with service health indicators
What you get
- Standard health-check endpoints for uptime monitoring
- Prometheus-compatible metrics for existing observability stacks
- Backs zero-downtime deploys on our own infrastructure
More in Platform
Related capabilities in the same part of Travix Cloud.
Feature Flags
Toggle features per tenant and subscription plan — including travel item types like airline and hotel. Enable a module without waiting on a code deployment.
Document Storage
S3-backed file storage, organized by category. Upload, download via signed URLs, and attach documents to invoices, OCR jobs, and reconciliation imports.
Real-Time Notifications
In-app, email, and live WebSocket notifications for approvals, postings, and system events. Per-user preferences and unread counts keep everyone on the same page.
Smart UX
Cut down on data entry with smart defaults, party autofill, saved templates, and line-item suggestions. Forms learn from your customers, vendors, and past vouchers as you go.
Ready to run your agency on one ledger?
Join the travel businesses that traded spreadsheets and legacy ERP for a platform actually built around how agencies work.